Datadog
Published on October 18th, 2021Introduction
With this plugin, you can embed Datadog graphs and dashboards into Roadie Backstage. Datadog is a monitoring service for cloud-scale applications, providing monitoring of servers, databases, tools, and services through a SaaS-based data analytics platform.
At a Glance
| Prerequisites | Configuration Data:
|
| Considerations | ⚠️ Due to the limitation of Datadog sharing, the dashboard or graph must be publicly accessible in order for the plug-in to display the data. Make sure you do not share these URLs with untrusted actors. |
| Supported Environments | ☐ Private Network via Broker ☐ Internet Accessible via IP Whitelist ☒ Cloud Hosted |
How to embed a datadog dashboard in Roadie
Obtain the dashboard URL from Datadog that you will need for your metadata.
- Login to your Datadog account.
Get the dashboard URL.
-
Navigate to the dashboards list by hovering over dashboards on the page's left-hand side and selecting the dashboard list.
-
Select a dashboard from this list.
-
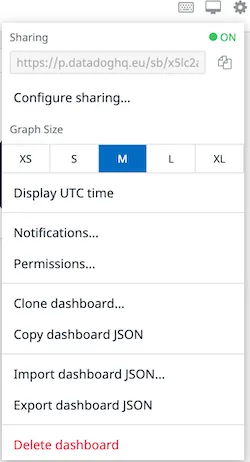
Within the dashboard you have chosen, click the settings cog on the screen's right-hand side, circled in red.

-
Copy the URL from the Sharing textbox.
-
This URL is the value you need for the
datadoghq.com/dashboard-urlannotation.
Adding the annotations and the values from Datadog to your component's metadata file.
apiVersion: backstage.io/v1alpha1
kind: Component
metadata:
  name: sample-service
  description: |
    A sample service
  annotations:
    datadoghq.com/dashboard-url: <<DATADOGURL>>
How to embed a datadog graph in Roadie
- Login to your Datadog account.
Get the graph token.
- Click on the graph pencil, circled in red, from your dashboard.

-
Click on the Share tab, choose a timeframe, graph size and legend. Click generate the embedded code.
-
Copy the token value that is highlighted in the red square.
-
this token is the value you need for the
datadoghq.com/graph-tokenannotation

Customize graph size.
In order to customize size of the graph you may specify datadoghq.com/graph-size annotations and specify one of the following options:
-
'small'
-
'medium'
-
'large'
-
'x-large';
If not specified, your graph will be 'medium' size per default.
Adding the annotations and the values from Datadog to your component's metadata file.
apiVersion: backstage.io/v1alpha1
kind: Component
metadata:
  name: sample-service
  description: |
    A sample service
  annotations:
    datadoghq.com/graph-token: <<TOKEN>
Adding UI components
The Datadog plugin exposes two different component that can be used in your Roadie application:
- EntityDatadogGraphCard, a card component that can be added as a widget to Overview and dashboard tabs
- EntityDatadogContent, acomponent that can be used as a standalone tab
The EntityDatadogGraphCard uses datadoghq.com/graph-token annotation and displays individual graphs on your dashboard.
For more information how to add card components to Roadie take a look at the documentation on how to update dashboards..
The EntityDatadogContent uses datadoghq.com/dashboard-url annotation as displays Datadog dashboards.
This component can be added as a tab to component layouts.
Add a Datadog card to the overview tab of the Entity Page
Click the cog icon on the top right of a component page. Then click add card.

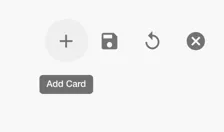
Select the datadog graph card from the drop down and Click add. Press save to submit.

Specify datadog domain
The Datadog Backstage plugin uses datadoghq.eu as the default top-level domain. If you would like to use a different Datadog domain, you must specify it with a corresponding annotation on your catalog-info.yaml file.
Adding the annotations and the values from Datadog to your component's metadata file.
apiVersion: backstage.io/v1alpha1
kind: Component
metadata:
  name: sample-service
  description: |
    A sample service
  annotations:
    datadoghq.com/site: datadoghq.com