Grafana Plugin
Published on March 7th, 2022Introduction
The Backstage Grafana plugin integrates with Grafana to list alerts and dashboards for your entities.
At a Glance
| Prerequisites | Configuration Data:
|
| Considerations | |
| Supported Environments | ☒ Private Network via Broker ☐ Internet Accessible via IP Whitelist ☒ Cloud Hosted |
Adding the plugin
Configuring Grafana Credentials
You can choose to configure Grafana in one of two ways:
- Assuming that there is network connectivity between Roadie and Grafana you can configure this using direct access.
- or you can choose to run the Roadie Grafana broker internally to open a connection between Roadie and Grafana.
Configure the Grafana endpoints for direct access
Configure the Grafana endpoints to use via Administration -> Settings -> Grafana. If you're using grafana.net your
frontend and backend endpoints should be the same e.g. https://<your-company>.grafana.net/. If you're using hosting
Grafana yourself you'll need to specify a url to the frontend which is used by backstage to generate links and an API
endpoint which the plugin uses to query alerts and dashboards.
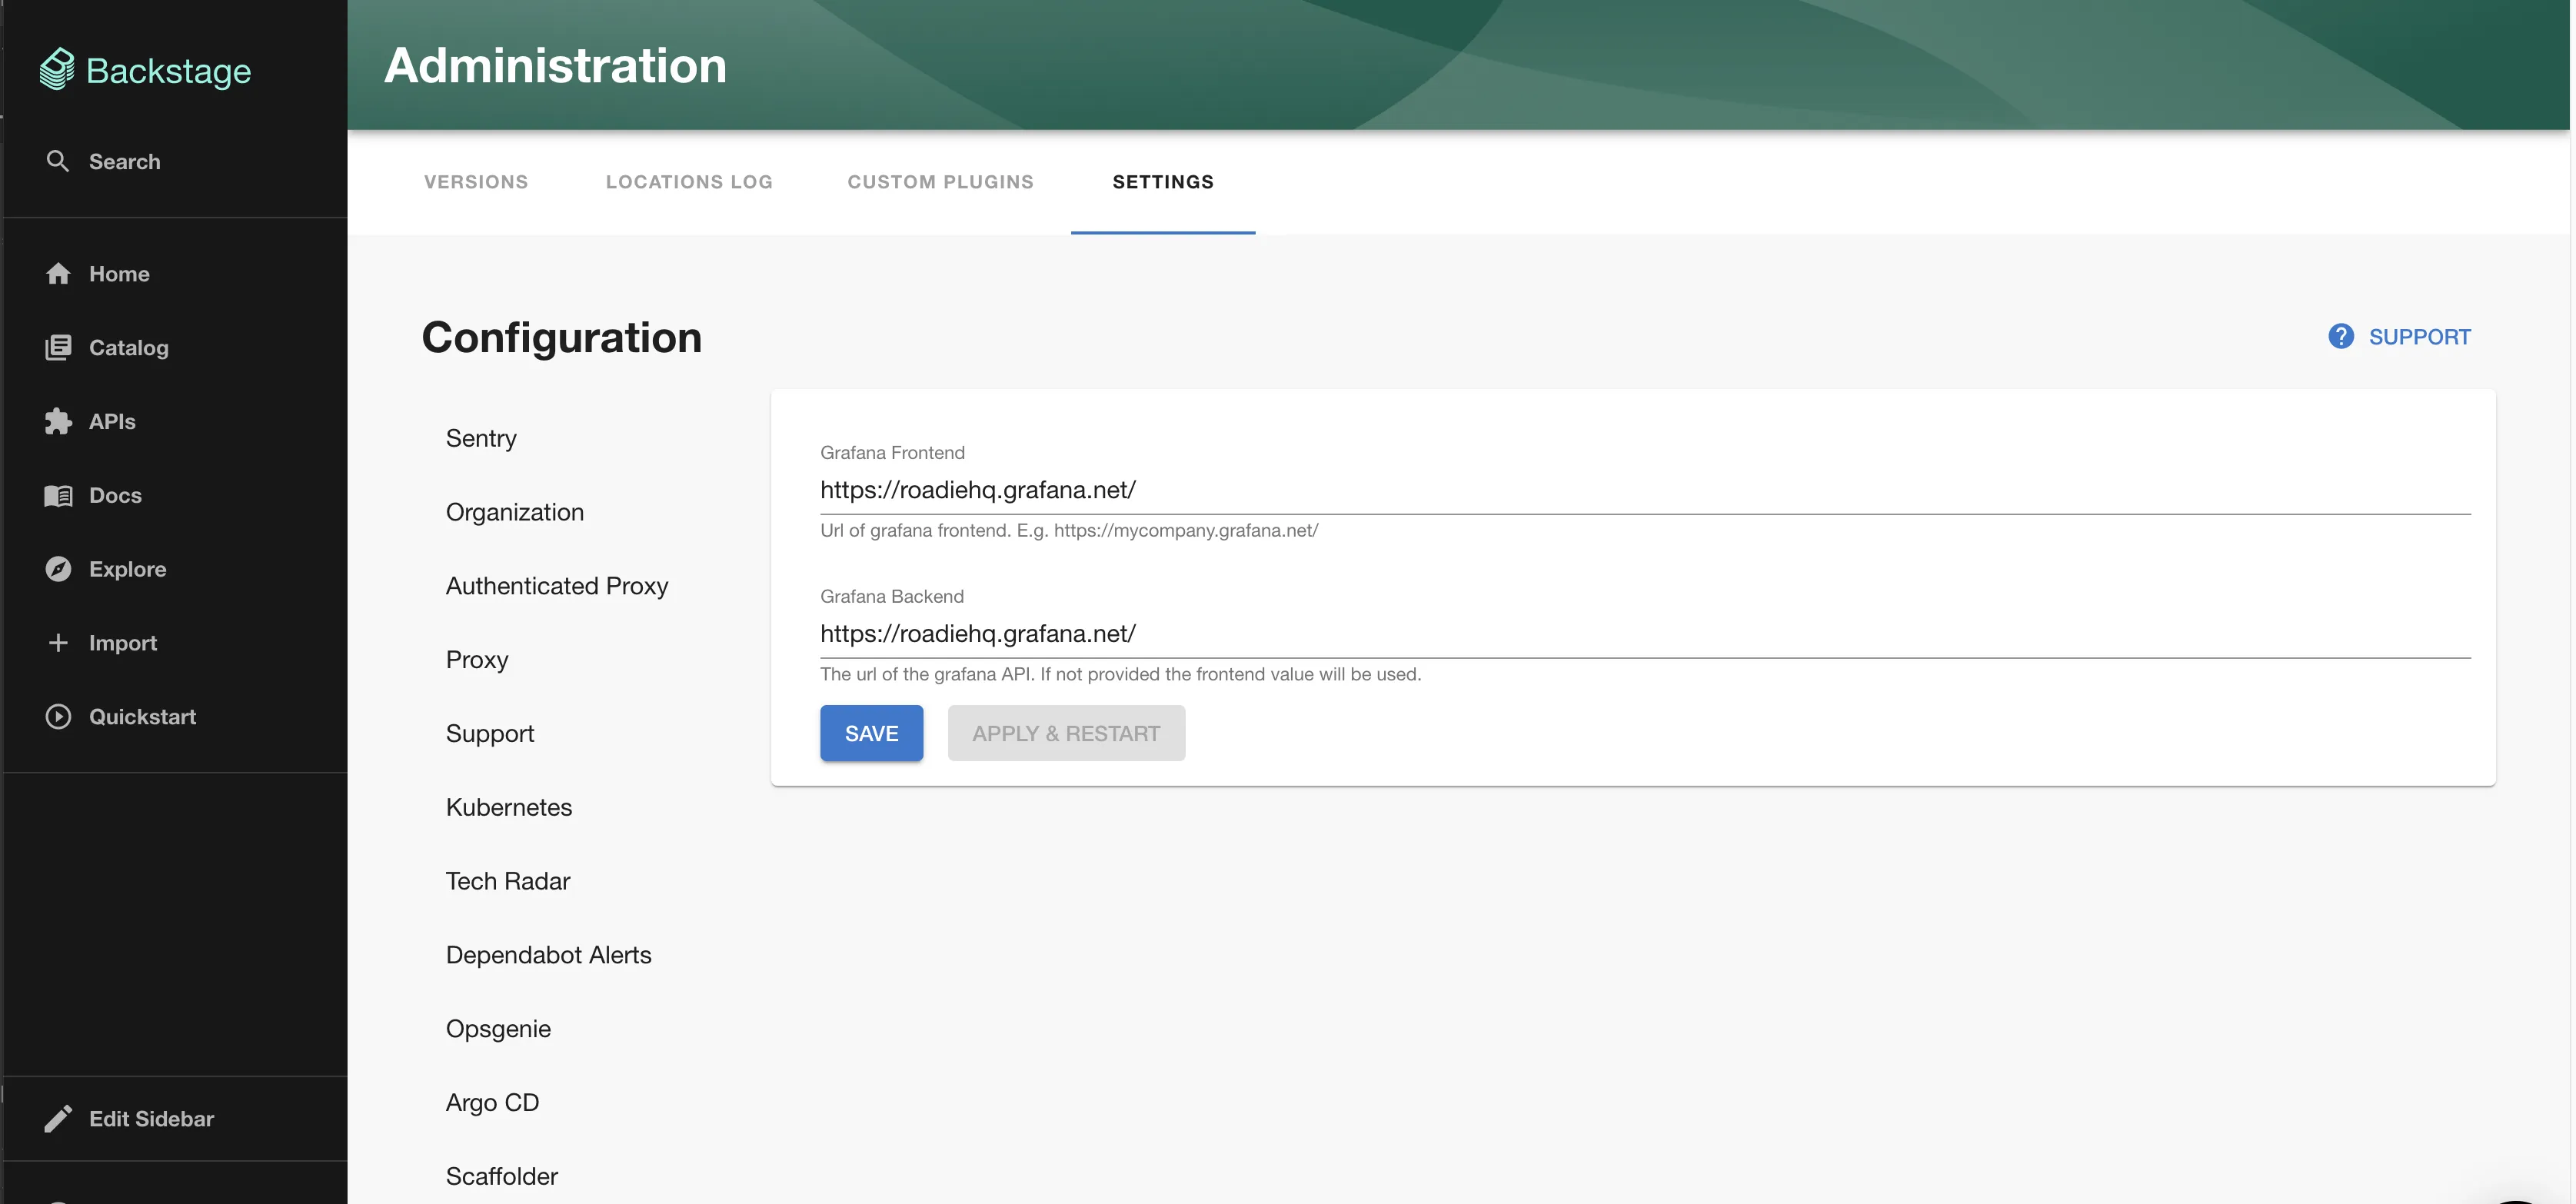
Add the Grafana API Key
Set the Grafana Frontend URL, Backend URL and the GRAFANA_API_KEY in same page at /administration/grafana.
NB: You'll need to wait for the secret to be marked as "Available" before you can use the Grafana plugin.
Configure Grafana via the Roadie Broker
You will need to run the broker container in an environment that has connectivity to the Grafana API as follows:
docker run \
  -e GRAFANA_TOKEN=<your grafana token> \
  -e GRAFANA_URL=http://<your grafana backend api> \
  -e "BROKER_TOKEN=grafana" \
  -e "BROKER_SERVER_URL=https://<tenant-name>.broker.roadie.so" roadiehq/broker:grafana
In Administration -> Settings -> Grafana, set the Frontend url to the URL at which the Grafana UI is available your users. Set the Backend URL to broker://grafana. You should leave the GRAFANA_API_KEY blank.
Add the plugin to the UI
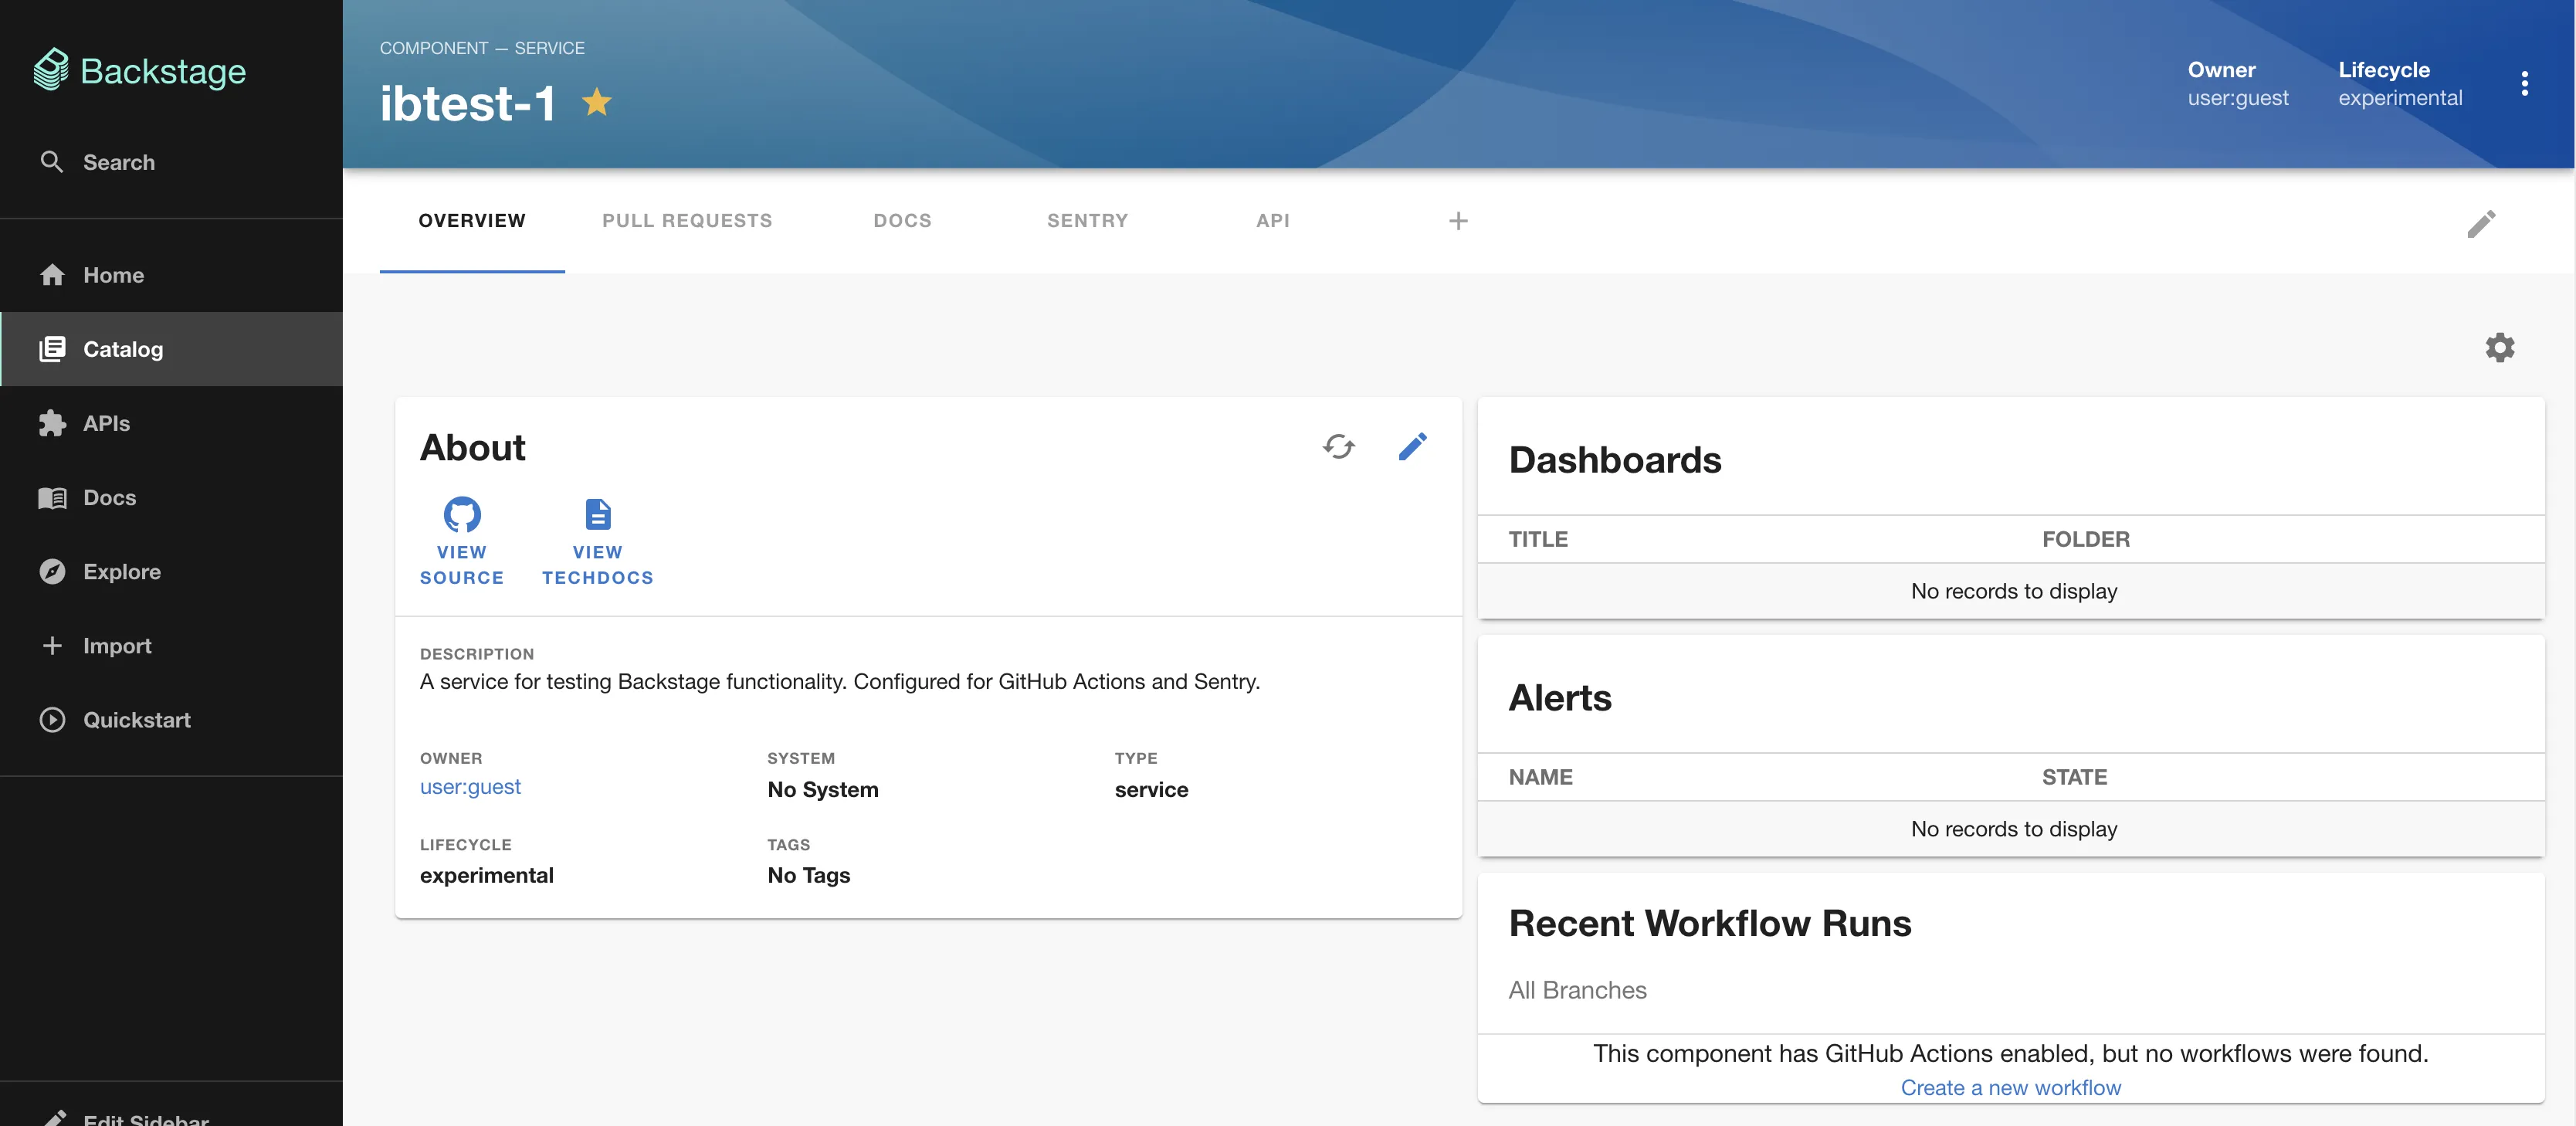
The Grafana plugin provides two components which can be added to the Backstage UI. You must be a Backstage admin to add components to the UI.
The EntityGrafanaDashboardsCard and EntityGrafanaAlertsCard components can be added to catalog dashboards. These
list dashboards and alerts respectively.
Set the Grafana annotation on entities
The Grafana plugin uses an annotation to link entities in the Backstage catalog to data in Grafana. This annotation should have a tag in Grafana as its value. Any alerts or dashboards with this tag will be displayed once the annotation is set and the components added to the UI.
Make a PR to the following to your catalog-info.yaml file:
annotations:
  grafana/tag-selector: 'my-grafana-tag'