Agent Sessions
Published on August 6th, 2026Introduction
Every tool call an agent makes against your Context Store is recorded. Observe → Agent Sessions is where you read that record back.
Calls are grouped into sessions by correlation ID, so a session shows one piece of work: which agent, acting as which user, called which tools in which order, and what came back.
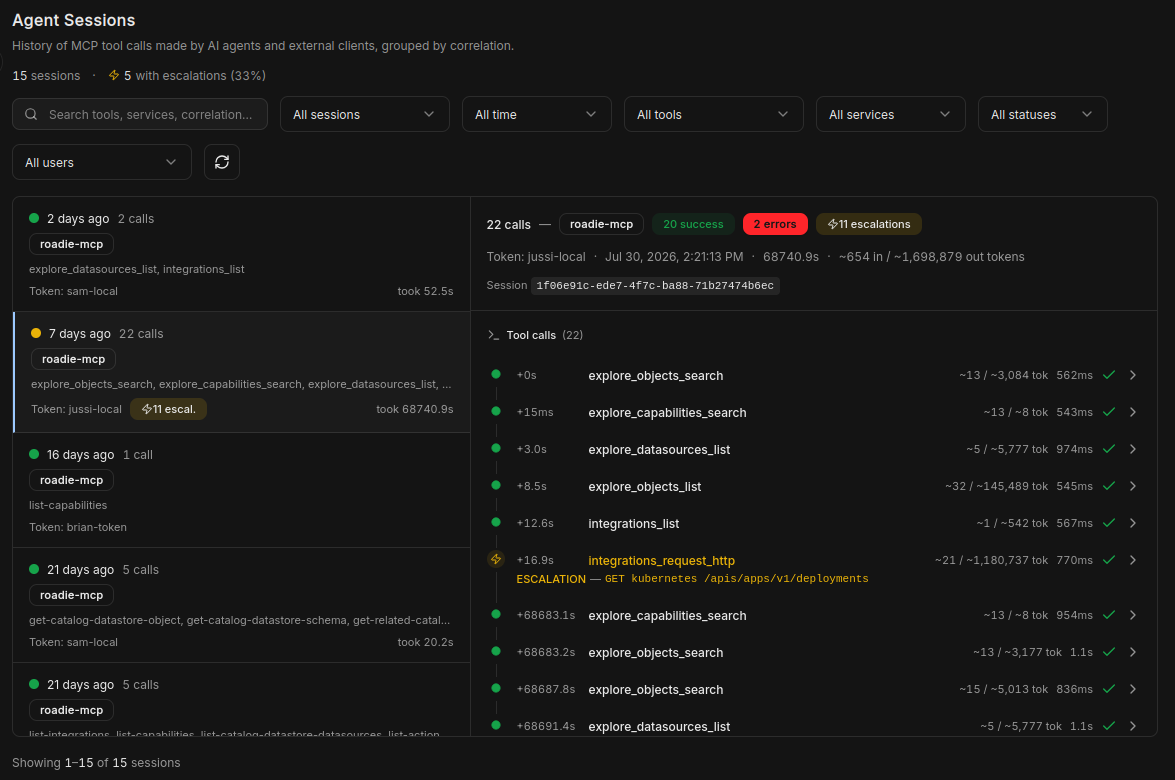
The session list
Each session in the list shows when it ran, who ran it, which MCP servers it touched, how many calls succeeded and failed, and the approximate tokens consumed.
Identity resolves two ways. OAuth users appear under their own identity. Requests made with a Service Token appear as Token: <name>, which is a reason to give each agent its own token rather than sharing one.
Filters
| Filter | Narrows to |
|---|---|
| Search | Free text across the session's calls |
| Service | Which MCP server: explore, integrations, manage, actions |
| Tool | A specific tool |
| Status | Success or error |
| User | A specific user or token |
| Escalations | Only sessions that reached out to a live system |
| Time range | Last hour, 6 hours, 24 hours, 7 days, 30 days, or all time |
The tool call timeline
Selecting a session shows its calls in order, each with its offset from the start of the session, its duration, its status, and its token counts. Expand a call to see the exact input the agent sent and the output it received.
This is usually where the answer to "why did the agent conclude that" is visible.
Escalations
An escalation is a call that went to a live external system through integrations_request_http or integrations_request_aws, instead of being answered from the graph.
Escalations are listed separately on a session, with the Integration, method, and path of each one. They are worth watching for two reasons:
- They are slower and they consume third-party rate limit.
- A repeated escalation indicates a gap in your Data Store. If agents keep reaching for the live API to answer the same question, that data is a candidate for ingestion as a Data Source, or for wrapping as an Action so the call is a vetted one.
Session telemetry
Tool calls on their own record what an agent did, but not what it was asked to do. Installing the openroadie plugin in a supported harness adds that context: the user's prompts, the model in use, when each turn ended and why, and any subagents the harness spawned, interleaved with the tool calls in the same timeline.
Supported harnesses:
| Harness | Telemetry |
|---|---|
| Claude Code | Prompts, model, subagent spans, tool calls |
| Codex | Prompts, model, subagent spans, tool calls |
| Cursor | Prompts, model, tool calls |
| OpenCode | Prompts, model, tool calls |
Installing
The app generates the exact install command for your instance. See Observe → Agent Sessions. It takes the form:
curl -sf <telemetry-url>/claude-code/setup.sh | bash
This installs both the MCP server connection and the telemetry hooks.
If you want the MCP server without telemetry, each harness has a plain alternative. For Claude Code:
claude mcp add openroadie --transport http https://app-api.roadie.so/api/mcp/v1/
Telemetry is posted with a token carrying only the mcp-telemetry:create scope. That scope is write-only and grants nothing else, so a leaked hook configuration can post telemetry but cannot call MCP tools or read data.
