Dynatrace
Published on April 4th, 2024Introduction
There are two Dynatrace plugins available for Backstage, the official Dynatrace plugin provided by Dynatrace and a community developed plugin called “Dynatrace for Managed”. This guide describes how to configure both plugins.
Dynatrace
The official Dynatrace plugin provides a card to display the results of DQL queries and has a card to display information from your kubernetes clusters.
Step 1 - Configure an environment
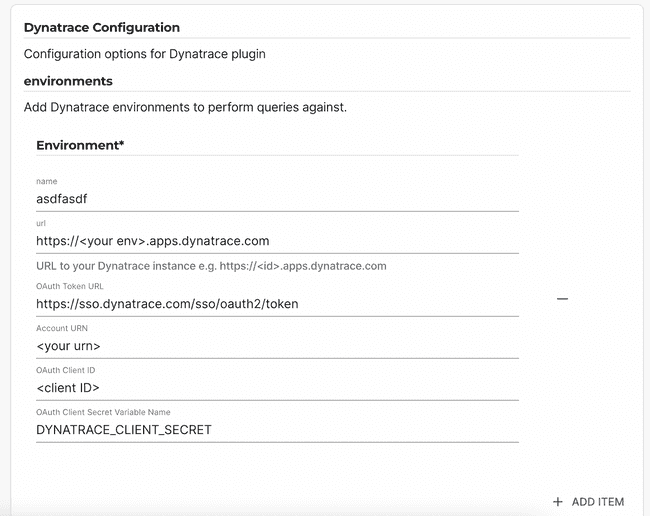
Firstly, follow the instructions on “How to create an OAuth 2.0 client” in the plugin docs. Then to configure an environment go to Administration > Plugins > Dynatrace and click “Add Item” under “Environments”. Enter the client and environment information and click “Save” below:
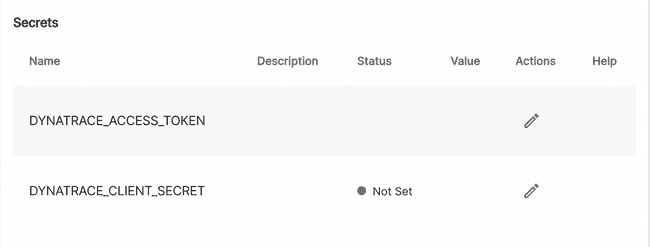
Then scroll down and add the client secret in the secrets section:
Step 2 - Add a DQL query (optional)
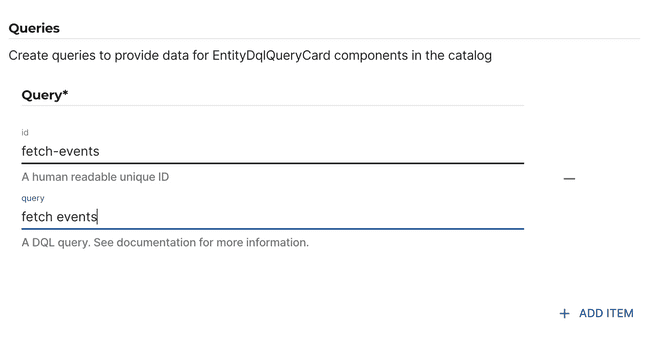
If you’d like to display a DQL query in the catalog you’ll need to add the query here in settings. Click ‘Add Item’ under queries and enter an ID and a query e.g. “fetch events” then click “Save” below. Record the ID as you’ll need this later. For this reason it’s a good idea to use a meaningful string as an ID e.g. “fetch-events”:
Dynatrace provide some variables you can use in these queries such as ${{componentName}} so you can make them relevant
to individual entities. See here for more information.
Step 3 - Add kubernetes annotations (optional)
If you’d like to display kubernetes deployment information via EntityKubernetesDeploymentsCard then you’ll need to add
annotations to your entities. See this guide for details.
Step 4 - Add the cards to the catalog
- If you completed step 2 then add
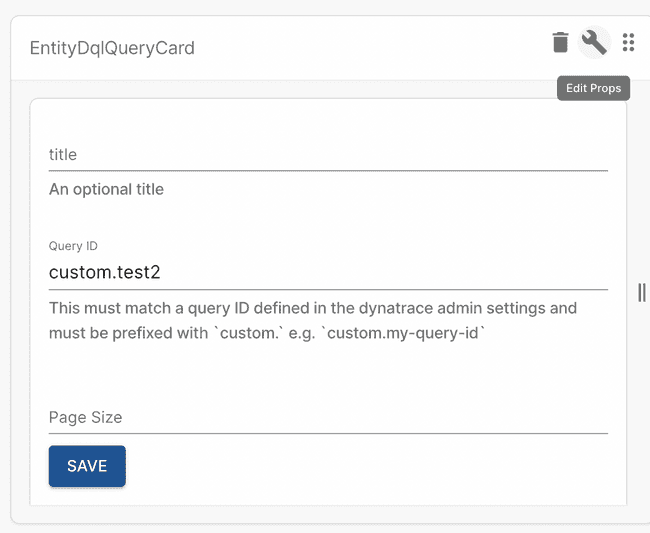
EntityDqlQueryCardto the catalog. Remember to add the query ID prop by clicking the
wrench icon and enter a value with the format custom.<query-id> e.g. custom.fetch-events. The query ID is the value
recorded in step 2.
- If you completed step 3 then add
EntityKubernetesDeploymentsCard.
See updating the UI for instructions on how to add cards.
Dynatrace For Managed
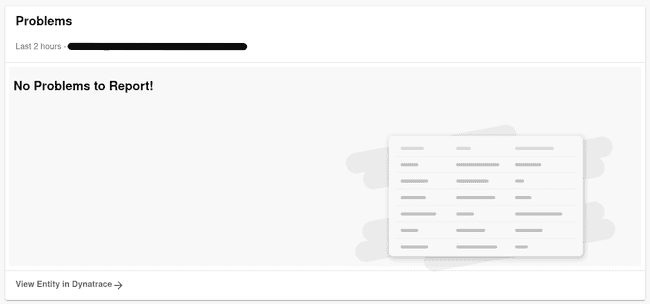
With this plugin, you can embed information about Dynatrace problems into your entity pages within Roadie.
Step 1 - Obtain Dynatrace API key
You need a Dynatrace API access token to be able to use the Dynatrace plugin. You can follow the instructions on how to retrieve the token in the Dynatrace documentation: https://docs.dynatrace.com/docs/dynatrace-api/basics/dynatrace-api-authentication.
The plugin requires an access token with the following permissions to be able to retrieve relevant information from the Dynatrace REST API:
entities.readproblems.readDataExportand/orExternalSyntheticIntegrationand/orReadSyntheticData
Step 2 - Configure your Dynatrace in Roadie
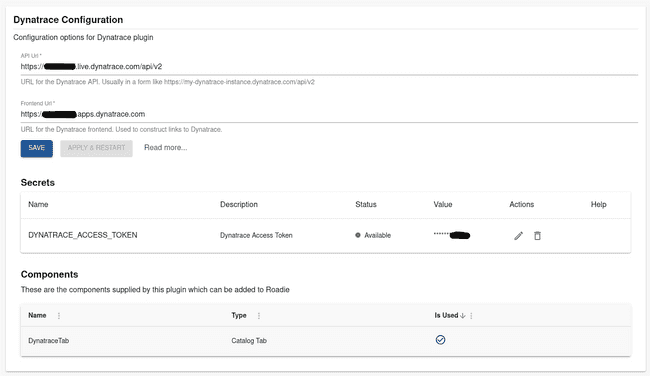
Navigate to Administration -> Settings -> Dynatrace and configure your instance URLs and the access token.
The configuration expects 2 different URLs:
- An API endpoint URL
- For SaaS Dynatrace this is usually in form of
https://{your-environment-id}.live.dynatrace.com/api/v2/ - For managed Dynatrace the URL should look like
https://{your-domain}/e/{your-environment-id}/api/v2/
- For SaaS Dynatrace this is usually in form of
- A URL pointing to your Dynatrace application frontend
- For SaaS Dynatrace the URL is something like
https://{your-environment-id}.apps.dynatrace.com
- For SaaS Dynatrace the URL is something like
Add your generated access token created in step 1 as a secret to the application. The secret to use for Dynatrace is called DYNATRACE_ACCESS_TOKEN.
Step 3 - Add Dynatrace annotations to your Entities
The Dynatrace plugin uses the following annotation to link Dynatrace entities to entities within Roadie:
dynatrace.com/dynatrace-entity-id- for example:
dynatrace.com/dynatrace-entity-id: SERVICE-1234ABCD4321DCBA
- for example:
The Dynatrace entity id can be found in Dynatrace by browsing to the entity (a service, synthetic, frontend, workload, etc.). It will be located in the browser address bar in the id parameter and has the format ENTITY_TYPE-ENTITY_ID, where ENTITY_TYPE will be one of SERVICE, SYNTHETIC_TEST, or other, and ENTITY_ID will be a string of characters containing uppercase letters and numbers.
If you want to display Dynatrace Synthectics results within Roadie you can also annotate your entities with annotation:
dynatrace.com/synthetics-ids- for example:
dynatrace.com/synthetics-ids: SYNTHETIC_ID, SYNTHETIC_ID_2, SYNTHETIC_ID_3
- for example:
The annotation can also contain a comma or space separated list of Synthetic Ids to surface details for multiple monitors!
The SYNTHETIC_ID can be found in Dynatrace by browsing to the Synthetic monitor. It will be located in the browser address bar in the resource path - https://example.dynatrace.com/ui/http-monitor/HTTP_CHECK-1234 for an HTTP check, or https://example.dynatrace.com/ui/browser-monitor/SYNTHETIC_TEST-1234 for a browser clickpath.
Step 4 - Add Dynatrace tab into your application
Navigate to a Catalog Entity page as an administrator and add a new tab. The name of the component you want to add in is DynatraceTab from package @backstage/plugin-dynatrace. Once you have configured the plugin URLs and authentication token, you should be able to see your Dynatrace problems for the entity.
